U.S. Real Median Wage Shows No Increase Since 2005; Highest Wage Growth Found in New Orleans, Pittsburgh, and DC; High-Wage Earners Did Best in San Jose; Low-Wage Earners Did Best in New Orleans
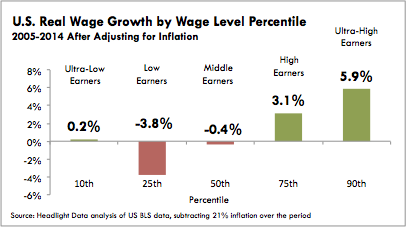
The real median wage in the U.S. has not increased from 2005 to 2014, falling 0.2% after accounting for inflation. Looking at wage performance across the spectrum of wage levels, Ultra-High Wage Earners enjoyed the fastest growing wages (+5.9% at the 90th percentile) and Low-Wage Earners saw declining wages (-3.8% at the 25th percentile). Ultra-Low Wage Earners saw slightly positive wage growth (+0.2% at the 10th percentile).
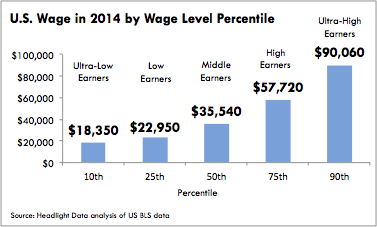
Wage levels vary from $18,000 per year at the Ultra-Low Wage level (10th Percentile) to $90,000 per year at the Ultra-High Wage level (90th Percentile).
Across the 52 largest U.S. metros (with 1+ million population), the highest growth in median wages was in New Orleans (+7%), Pittsburgh (+6%) and Washington, DC (+5%). Detroit had lowest median wage growth (-14%), followed by Grand Rapids (-11%) and Atlanta (-6%).

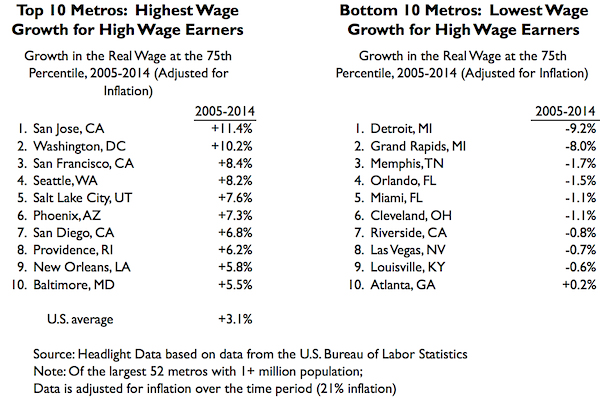
At the High Wage level (75th percentile), the metros that generated the most wage growth were San Jose (+11%), Washington DC (+10%) and San Francisco (+8%). Detroit had the largest wage decrease (-9%), followed by Grand Rapids (-8%) and Memphis (-2%).
 Click here to view an interactive map of wage growth for Low Wage Earners.
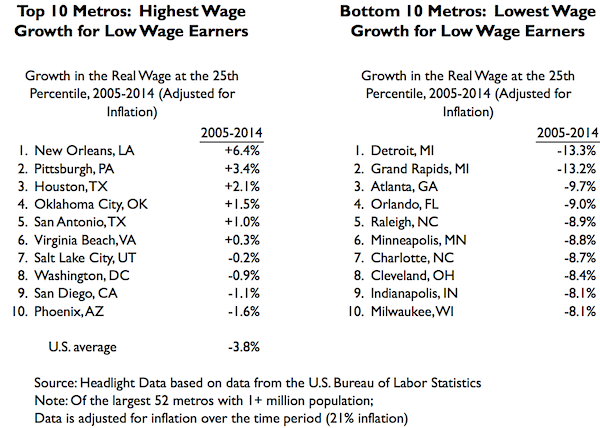
At the Low Wage level (25th Percentile), only 6 of the 52 largest metros saw wages grow from 2005 to 2014. New Orleans had the highest wage growth (6%), followed by Pittsburgh (3%) and Houston (2%). Wages decreased the most in Detroit (-13%), Grand Rapids (-13%) and Atlanta (-10%).
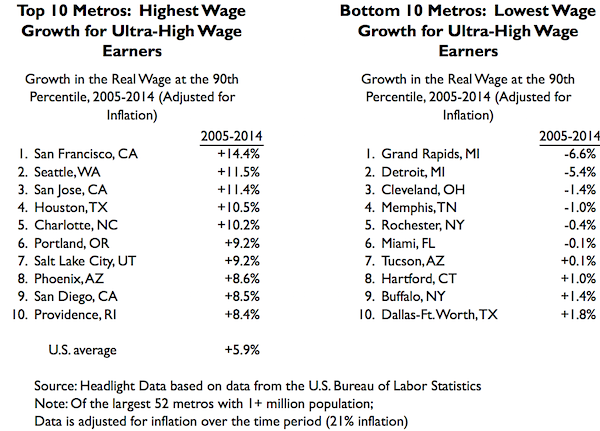
At the Ultra-High Wage level (90th Percentile), 47 of the 52 largest metros saw wages grow from 2005 to 2014. San Francisco had the highest wage growth (14%), followed by Seattle (12%) and San Jose (11%). Wages decreased the most in Grand Rapids (-7%), Detroit (-5%) and Cleveland (-1%).
Click here to download a spreadsheet of the data.
Research, analysis and content developed by Headlight Data. Original data from the U.S. Bureau of Labor Statistics' Occupational Employment Estimates program.
About Headlight Data:
Headlight Data is an award-winning online data aggregator, designed for economic and workforce development organizations, that provides online, decision-support tools on the economy, demographics, education, workforce and public policy.