Headlight Dashboard is a stand-alone or embeddable website with current, localized web charts sourced from a polished data catalogue produced using public, private, and modeled data — customized to your region.
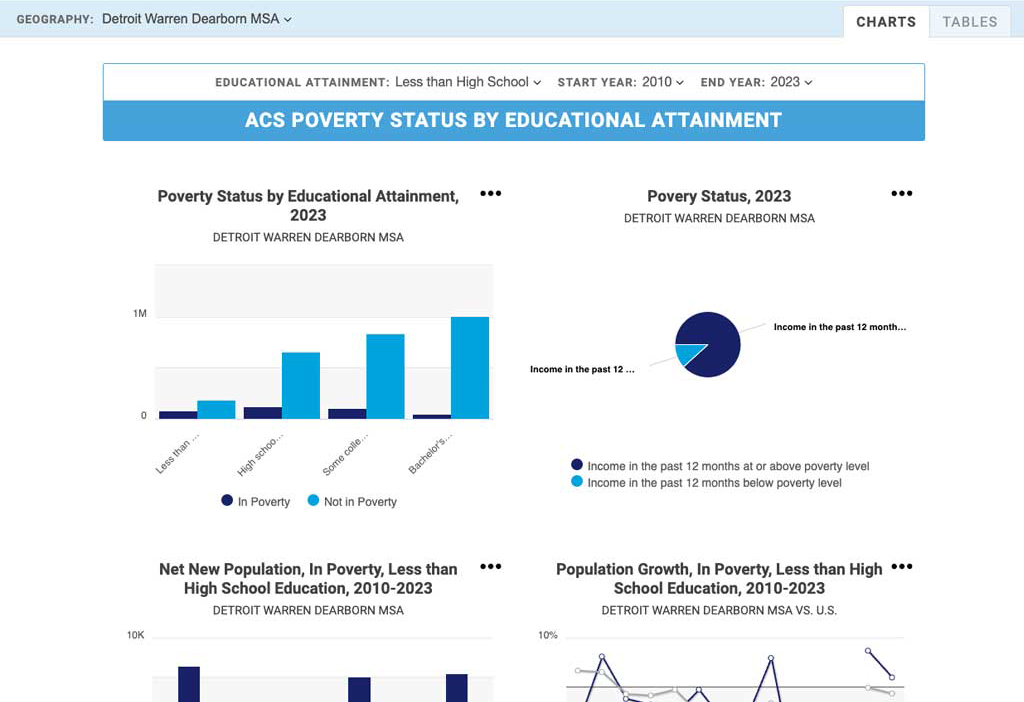
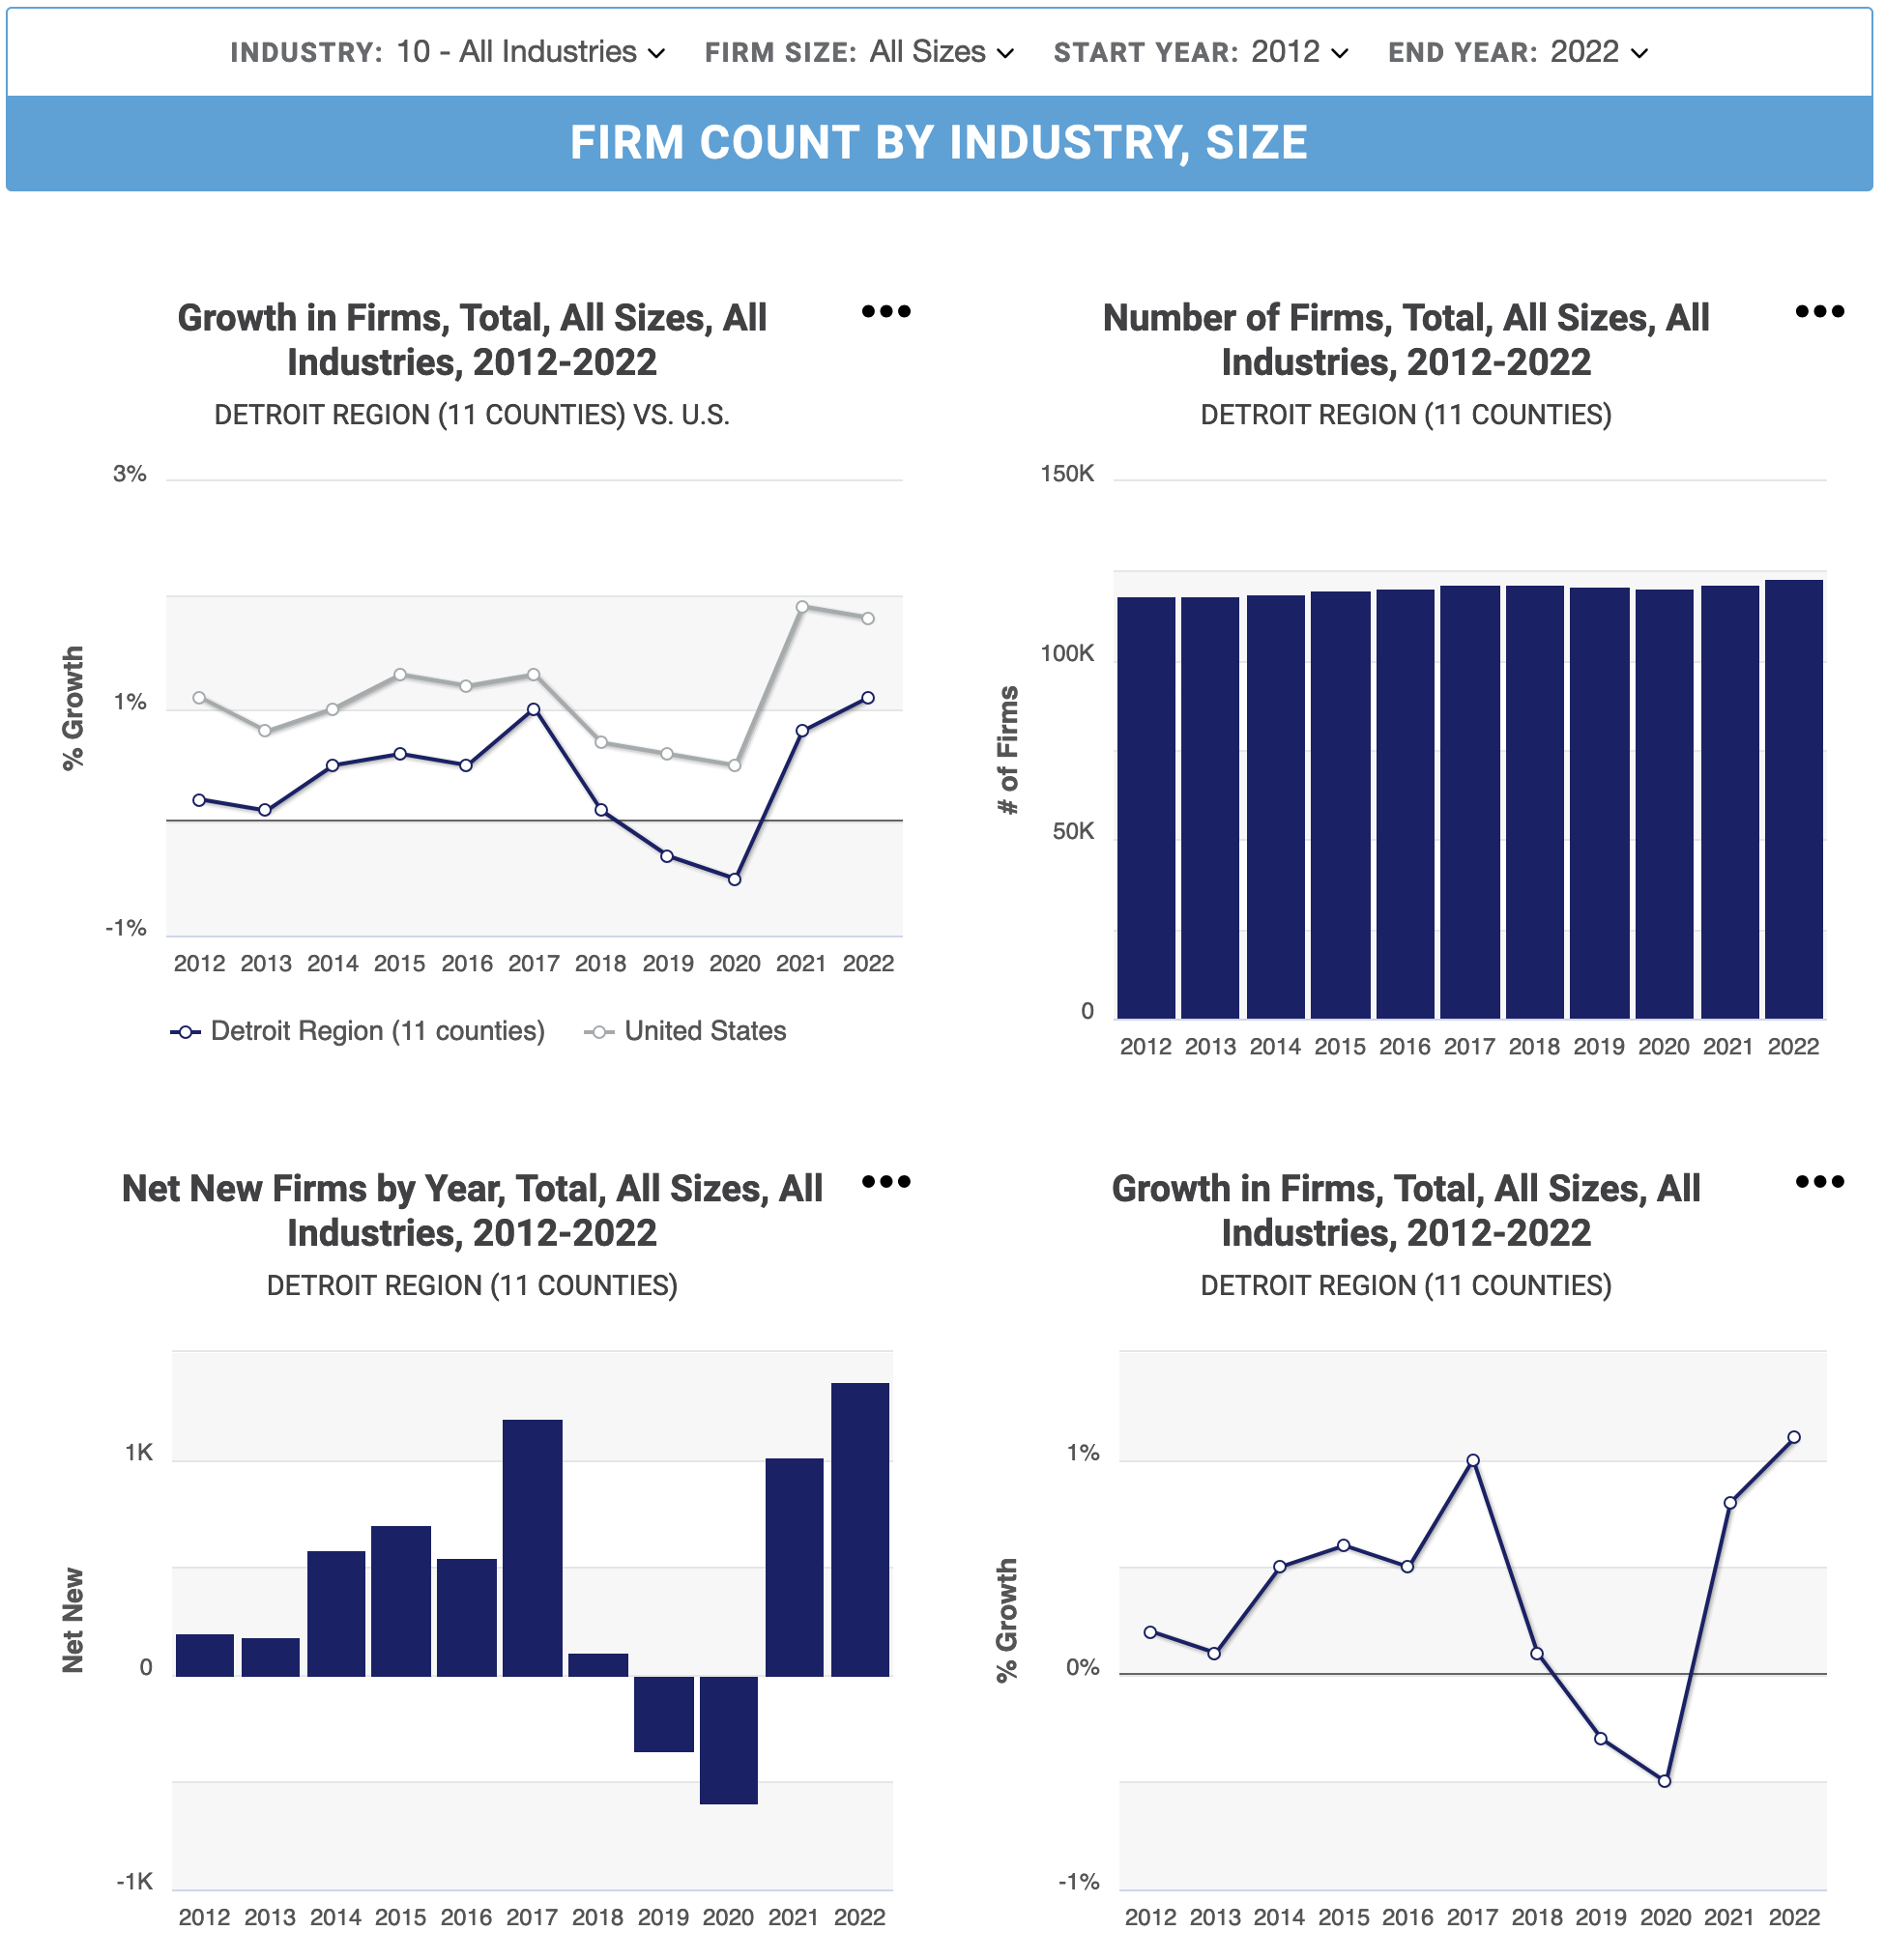
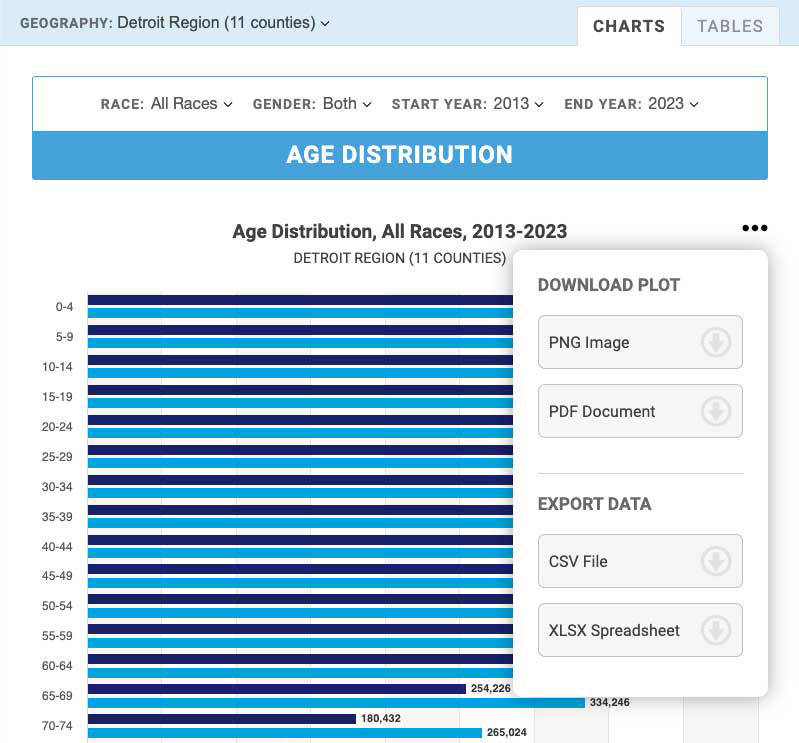
Headlight Dashboard charts and tables are presented in a common and easy-to-read web format, with options to filter, export, and share.
Headlight Dashboard displays are designed and authored in unison by Headlight Data’s economic consulting and software development teams.
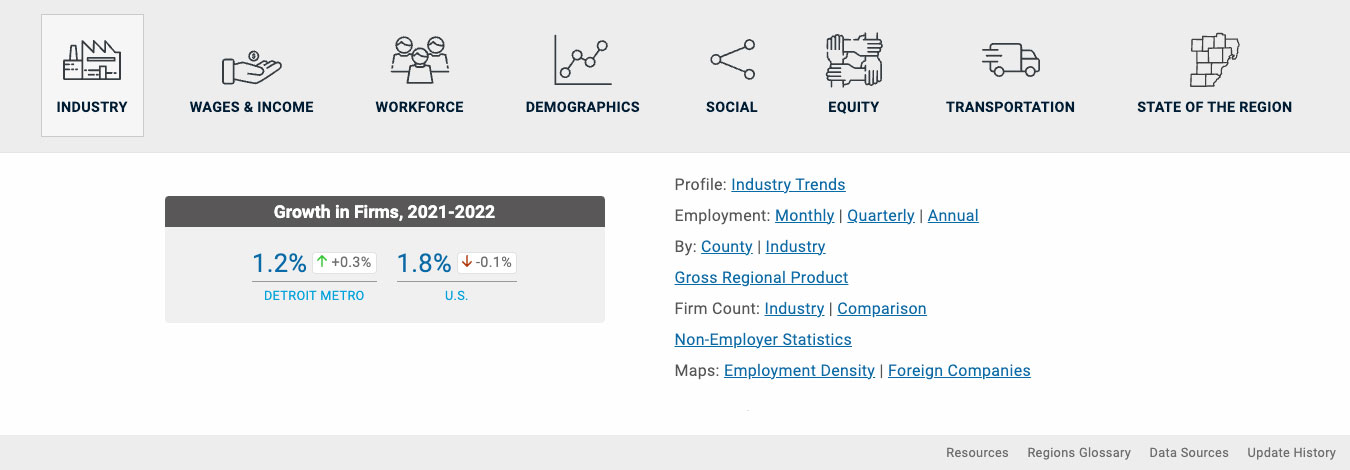
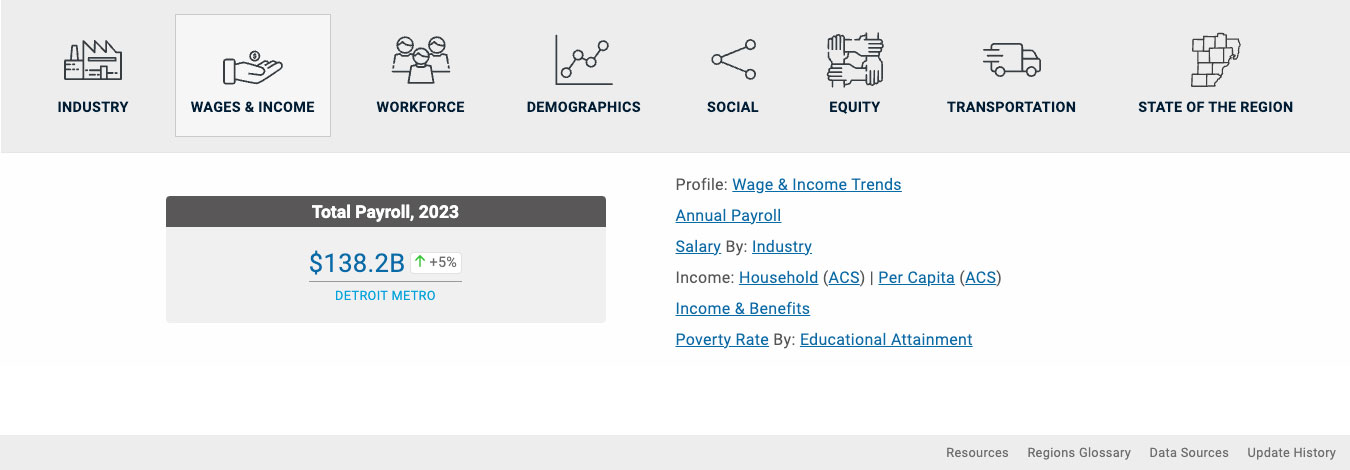
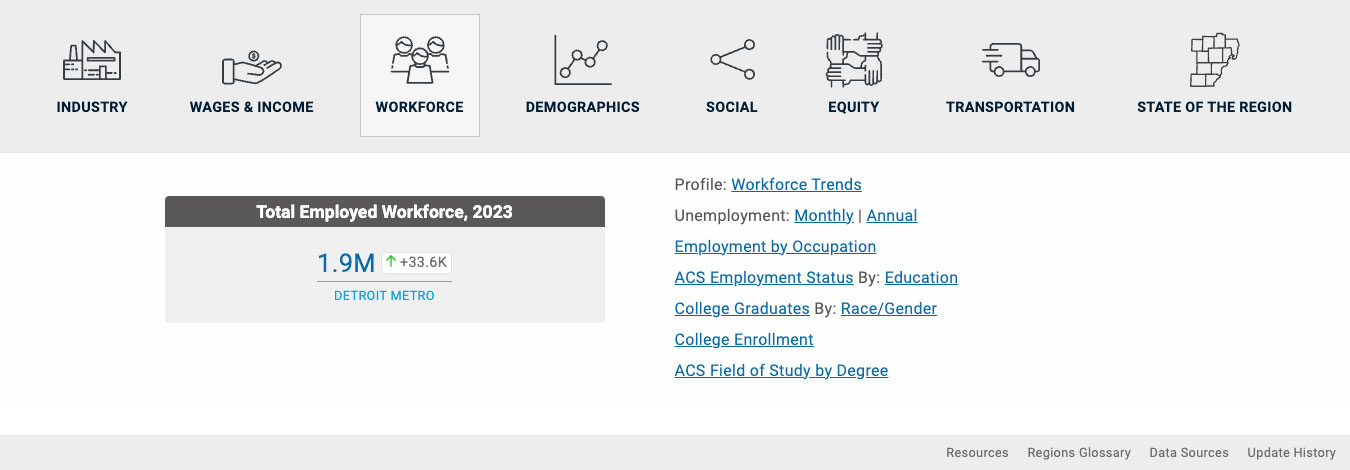
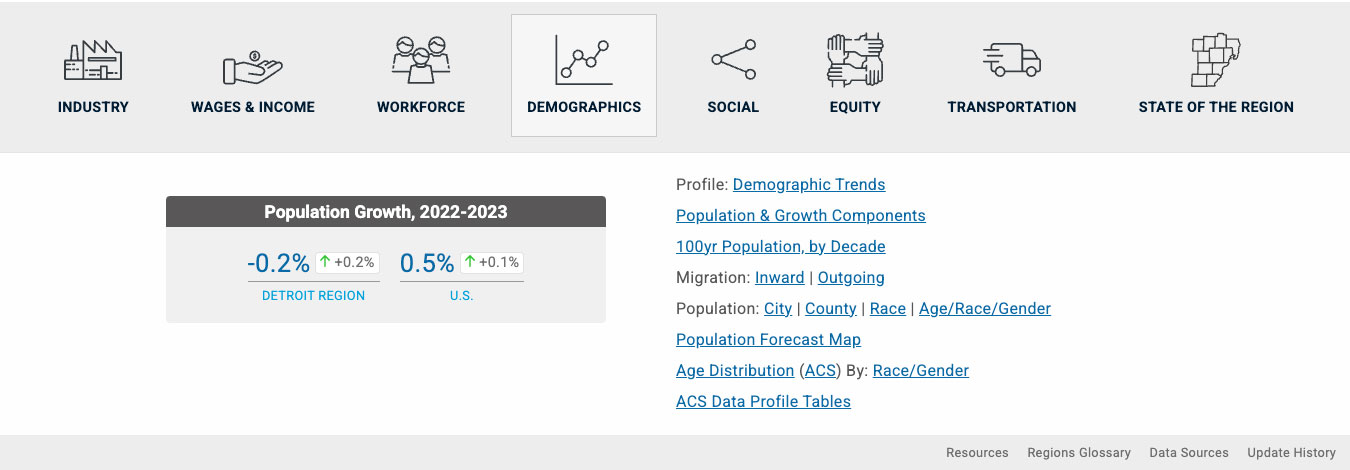
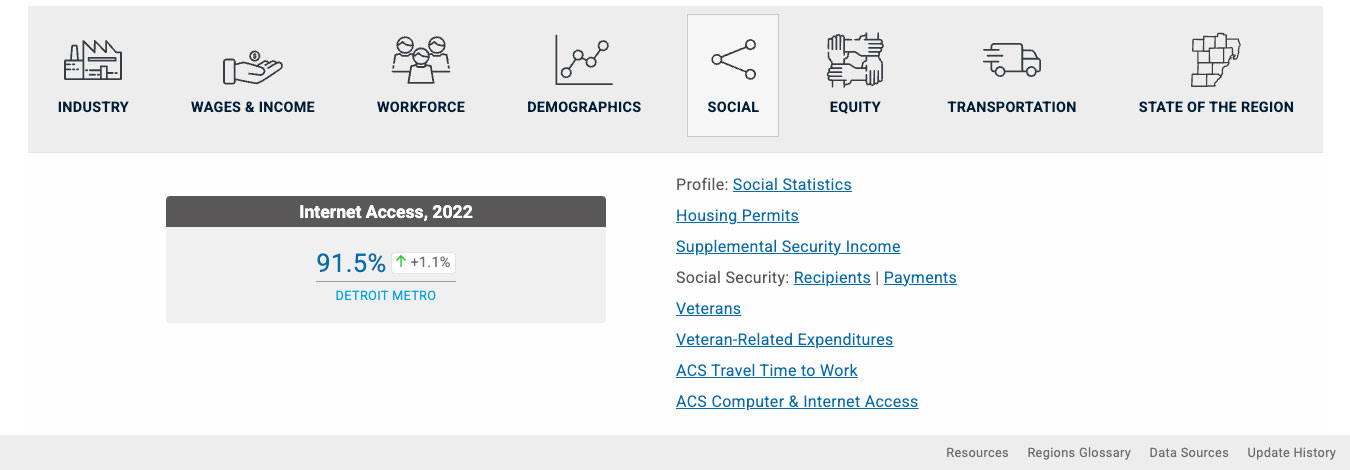
The extensive catalogue of data and reports are organized by category:
Underlying datasets are updated regularly, and in alignment with cited sources.
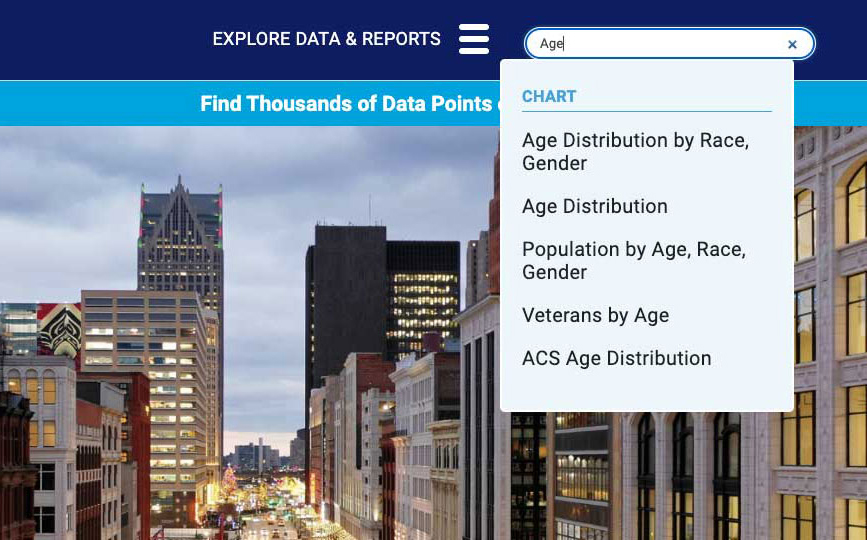
Lookup data and charts by topic across the entire Headlight Dashboard collection using the global Search system.
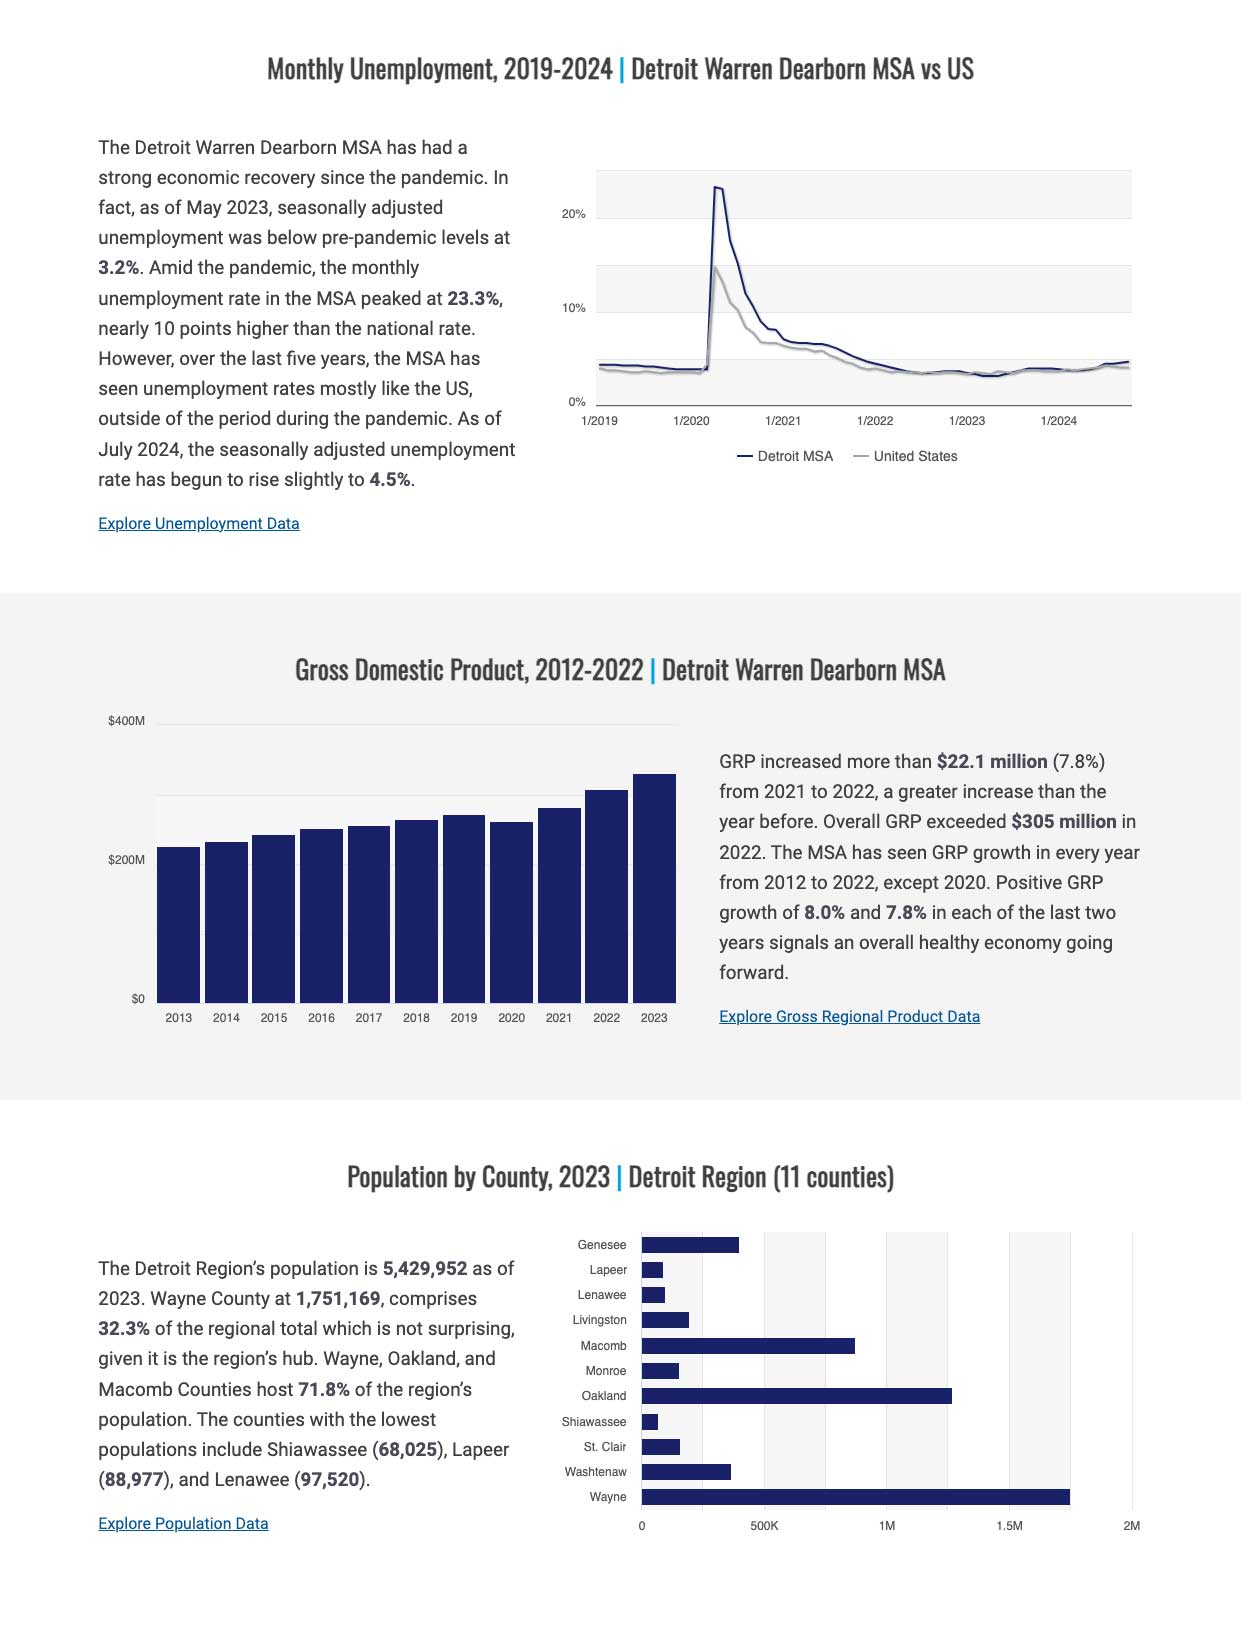
Home page infographic-style charts and narratives deliver a data story specialized to your local region showcasing important metrics like:
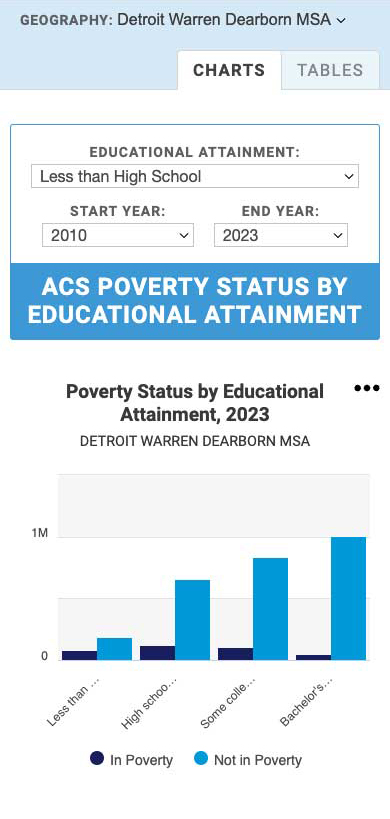
Headlight Dashboard is thoroughly supported and tested for Mac, WinPC, Android and iOS platforms, and supports both desktop and mobile devices.
All web content, including charts and tables, are built to meet “best practice” Web ADA compliance requirements.