Wage Growth Inequality Highest in Rhode Island, Maryland, New Hampshire; Lowest in North Dakota, Wyoming, Louisiana
Wage growth inequality can be defined as the difference between the wage growth for two different levels of wage earners.
Workers are split between “High Wage” earners and “Low Wage” earners. High Wage earners are those in the right half of the chart below and have a median wage at the 75th Percentile. Low Wage earners have a median wage at the 25th Percentile. The difference in median wage growth from 2005-2014 of these two groups is an indication of whether inequality has gotten better or worse over time.
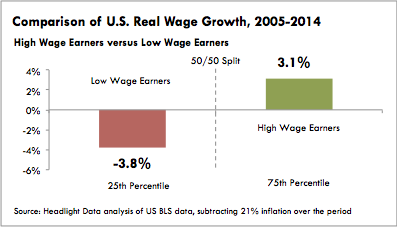
(See footnote for a full explanation of percentile levels and wage groups)
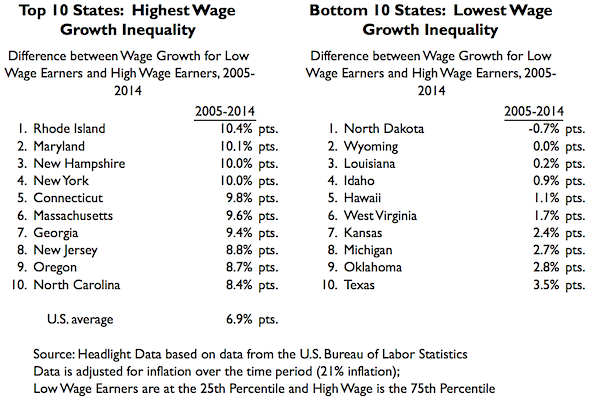
Among states, the highest wage growth inequality over the 2005-2014 period was in Rhode Island (a 10 percentage point difference in growth rates), followed by Maryland (10 percentage pts.) and New Hampshire (10 percentage pts.). All states experienced wage growth inequality that favored High Wage earners, with the exception of North Dakota (-0.7 percentage pts.). Wyoming (+0.0 percentage pts.) and Louisiana (0.2 percentage pts.) also had minimal wage growth inequality.
Note:
The U.S. Bureau of Labor Statistics releases percentile wage estimates as part of the Occupational Employment Statistics data. The median wage is the wage of workers in the middle of the distribution of all workers. Wages are also provided at the 10th, 25th, 75th, and 90th percentile. For example, the 25th percentile wage estimate is the wage value in which 25% of workers have lower wages. In 2014, North Dakota’s 25th percentile annual wage was $25,910, meaning that 25% of North Dakota employees earned less than $25,910 that year.
The percentile wage levels are used to form the following wage groups:
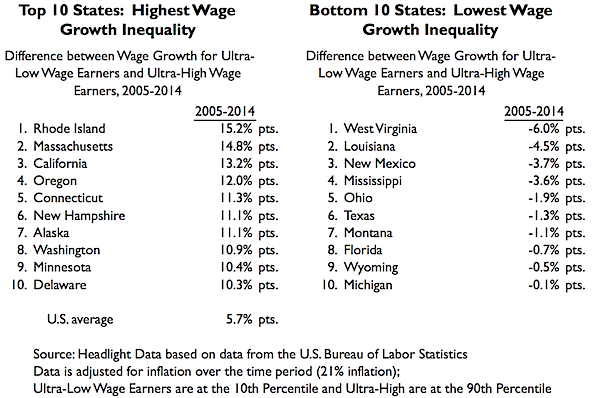
- Ultra-Low Wage Earners = Bottom 20% of wage earners, whose median wage is at the 10th percentile.
- Low Wage Earners = The bottom half of all wage earners, whose median wage is at 25th percentile.
- High Wage Earners = The top half of all wage earners, whose median wage is at the 75th percentile.
- Ultra-High Wage Earners = Top 20% of all wage earners, whose median wage is at the 90th percentile.
Click here to download a spreadsheet of the data.
Research, analysis and content developed by Headlight Data.
About Headlight Data:
Headlight Data is an award-winning online data aggregator, designed for economic and workforce development organizations, that provides online, decision-support tools on the economy, demographics, education, workforce and public policy.