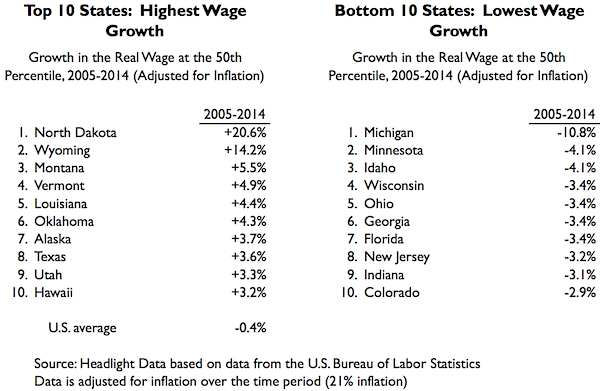
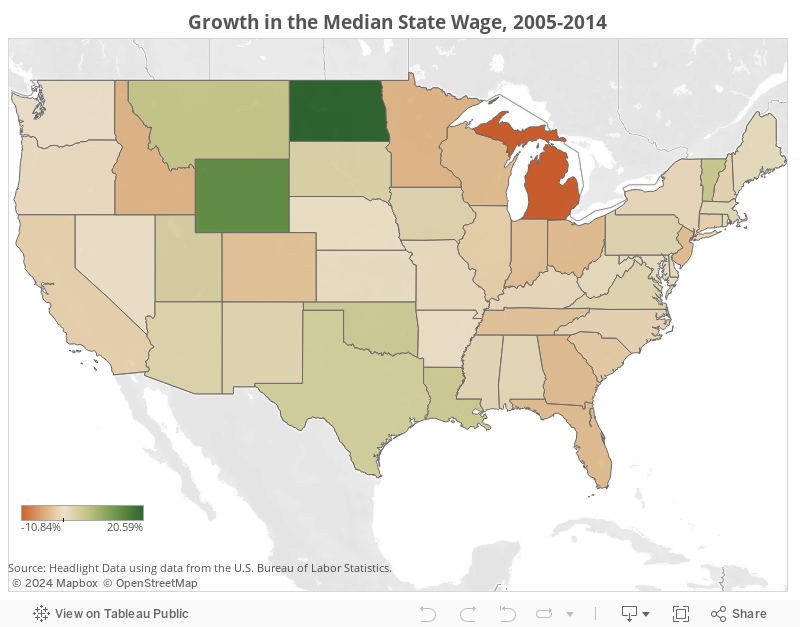
North Dakota has Fastest-Growing Median Wage Since 2005; Michigan Wages Declined the Most
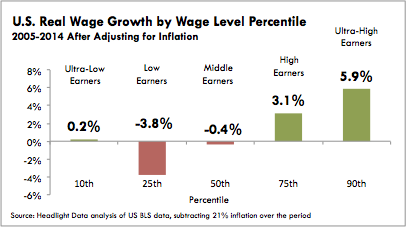
As first described in a previous article for large metros, wage performance can be examined at the median wage level and also across the distribution of wages. Since 2005, Ultra-High Wage Earners in the U.S. enjoyed the fastest growing wages (+5.9% at the 90th percentile) and Low-Wage Earners saw declining wages (-3.8% at the 25th percentile). Ultra-Low Wage Earners saw slightly positive wage growth (+0.2% at the 10th percentile).
(See footnote for a full explanation of percentile levels and wage groups)
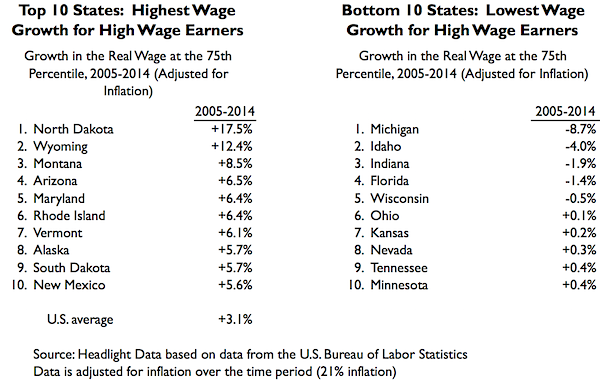
At the High Wage level (top half of all wage earners), the states that generated the most wage growth were North Dakota (+18%), Wyoming (+12%) and Montana (+9%). Only 5 states saw High Wages decrease from 2005 to 2014. Michigan had the largest High Wage decrease (-9%), followed by Idaho (-4%) and Indiana (-2%).

At the Low Wage Level (bottom half of all wage earners), North Dakota led wage growth (18%), followed by Wyoming (12%) and Montana (4%). The Low Wage decreased the most in Michigan (-11%), Georgia (-8%) and Ohio (-8%).


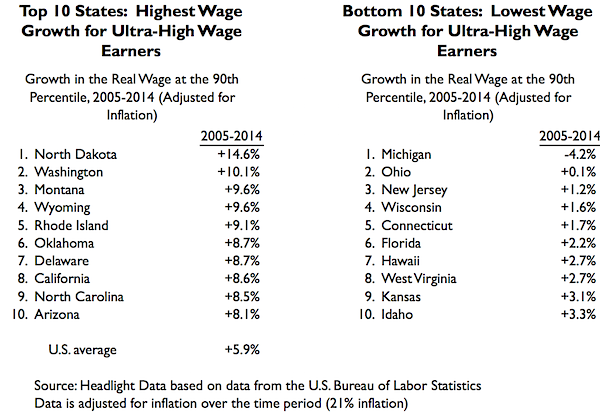
At the Ultra-High Wage level (top 20% of all wage earners), North Dakota had the highest wage growth (15%), followed by Washington (10%) and Montana (10%). Only 1 state saw wages shrink at the Ultra-High Wage level from 2005 to 2014. Wages decreased in Michigan (-4%), and increased slightly in Ohio (0.1%) and New Jersey (1%).
The U.S. Bureau of Labor Statistics releases percentile wage estimates as part of the Occupational Employment Statistics data. The median wage is the wage of workers in the middle of the distribution of all workers. Wages are also provided at the 10th, 25th, 75th, and 90th percentile. For example, the 25th percentile wage estimate is the wage value in which 25% of workers have lower wages. In 2014, North Dakota’s 25th percentile annual wage was $25,910, meaning that 25% of North Dakota employees earned less than $25,910 that year.
The percentile wage levels are used to form the following wage groups:
- Ultra-Low Wage Earners = Bottom 20% of wage earners, whose median wage is at the 10th percentile.
- Low Wage Earners = The bottom half of all wage earners, whose median wage is at 25th percentile.
- High Wage Earners = The top half of all wage earners, whose median wage is at the 75th percentile.
- Ultra-High Wage Earners = Top 20% of all wage earners, whose median wage is at the 90th percentile.
Click here to download a spreadsheet of the data.
Research, analysis and content developed by Headlight Data.
About Headlight Data:
Headlight Data is an award-winning online data aggregator, designed for economic and workforce development organizations, that provides online, decision-support tools on the economy, demographics, education, workforce and public policy.