US Federal Workforce Declines 9% in 2025; Over Two-Thirds of Metros Lose Jobs
After 154,000 federal workers participated in the Deferred Resignation Program, receiving full pay and benefits through last September, the latest numbers from the BLS now give us the full impact of federal workforce reductions.
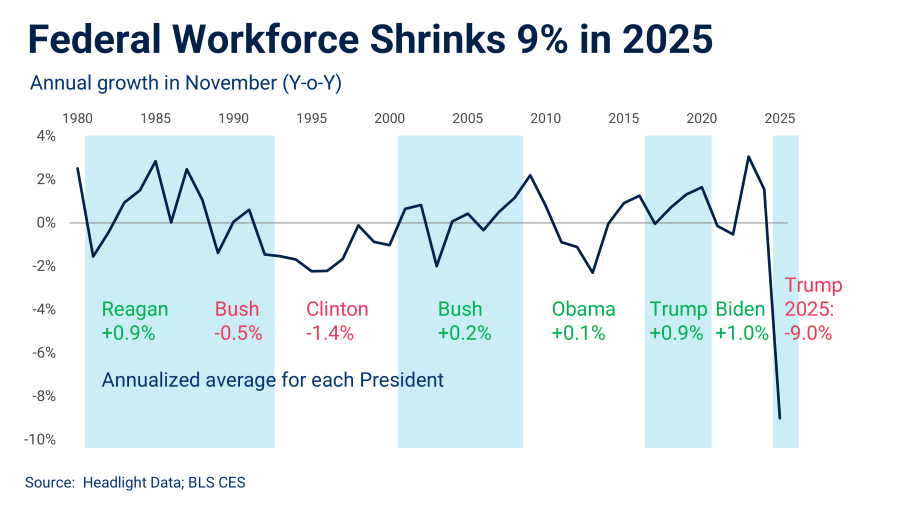
Federal (civilian) headcount declined 9% in November 2025 versus the previous November, for a total of 271,000 fewer workers after peaking at 3 million in 2024. This percentage decline is the largest since the drawdown during the last years of World War II. The chart below shows annual growth since 1980, with annualized averages for each President.
We typically think of the “federal workforce” as primarily workers in Washington, DC, but most people would be surprised that the DC region (including the Baltimore metro) accounts for just 15% of total federal (civilian) workers. As such, 68% of the largest 358 metros across the US experienced a decline in federal workers in 2025.
Federal Worker Growth, November 2025 (Year-over-Year)
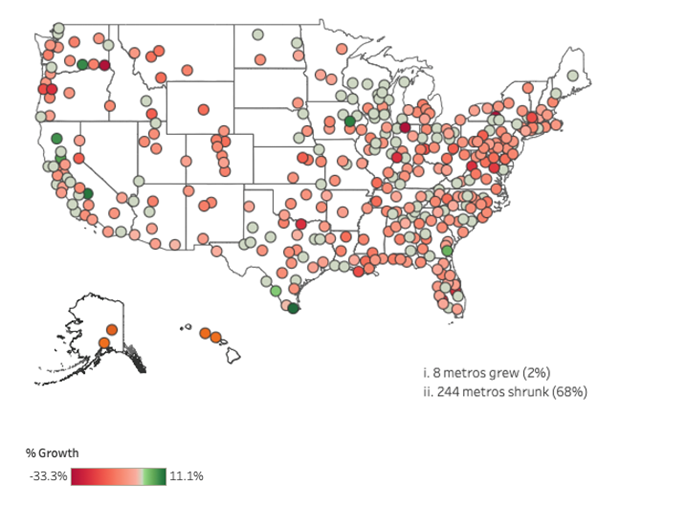
Federal job loss leaders were in metros across the full breadth of the US: Virginia Beach, Atlanta, Honolulu, Detroit, Denver, Kansas City, and Lexington Park/MD (in order of most jobs lost and at/exceeding US job loss rate) – which happen to be military base locations.
Still, as shown by the map, most metros lost jobs. And, Washington DC’s loss of 52,000 jobs reflected just 1.5% of its diverse job base. The handful of metros with job growth were mostly along the Texas border and inland California (and Kennewick and Cedar Rapids).
Click here to explore the interactive map on our website to see how your metro area was affected and see the rankings for federal workforce growth by metro size category.
We’ll continue to monitor federal employment, and our Scorecard (linked above) will be updated monthly for you to monitor your own economy.