From the Founder’s Desk: In the Age of AI and its Impact on Jobs, Should We Re-Prioritize Recruiting People?
By Chris Engle, CEO & Founder, Headlight Data
A core activity of economic development organizations is seeking growth through recruitment: jobs, people, investment, etc. But as our job base shifts to AI and our “production capacity” moves into distant data centers, should we make attracting people our fundamental goal again?
Jobs and investment are a means to an end. Spending, tax revenue, and individual prosperity are the end-goals. How can we attract jobs without concern that they might not “stick” or that companies may not commit to job creation in return for incentives?
The history of “population attraction” as economic development is as old as time. I’m reminded of magazine advertisements from the 1800s from Texas (my home state) bragging that Texas was 3 times larger than Great Britain (in land area) and could support 30 million people (my recollection). I’m sure you’ve seen such ads (historic or new) from your own home states. And sure, we see today many talent attraction efforts but they are often too focused on young professionals (why not retirees and their wealth?), specific industries, or remote workers (stipends).
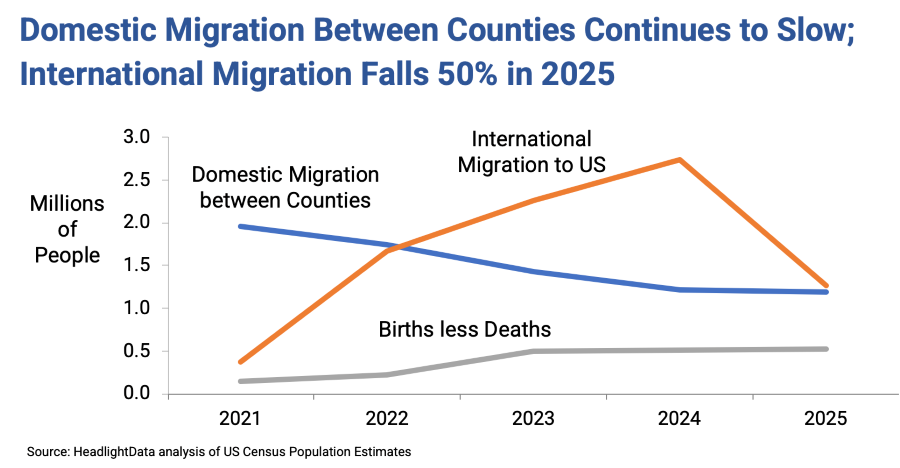
So how do migration trends in the US look today? Let’s examine the latest population growth data published by the Census Bureau a few weeks ago for 2025. First, let’s all get on the same page on how communities/counties get their population growth:
- Migration from other counties
- International migration
- Natural growth (births less deaths)
What do trends from the last 5 years show? Domestic migration between counties has slowed in the last 5 years, as the “pandemic shuffle” came to an end (2021 was 2M, but 2025 was down 40% to 1.2M). International migration slowed considerably last year. And on a positive note, high death rates in 2021 and 2022 due to the pandemic have subsided, returning our “natural growth rate” (births minus deaths) to just over 500,000 per year.
What’s truly interesting is seeing how these 3 growth components – domestic, international, natural – vary across counties when visualized in maps. Let’s look at the natural rate first. All maps show a total 5-year percentage growth rate due to the component versus the 2020 population.
A good way to look at the “natural rate” is to ask, “What parts of the US would shrink without migration?” The truth is that two-thirds of counties would. That’s right: Just 34% of US counties had more babies that deaths in 2025. What regions stand out?
- Most of Appalachia from Arkansas to Pennsylvania and all the way up to Maine would lose population due to negative natural increase.
- Much of high-growth Florida would lose population (due to retirees) and depends on migration to grow.
- Portions on west Texas, Oklahoma and Kansas don’t produce natural growth.
- The central Rockies enjoy high population growth due to young families.
- Racial diversity and young families in southern California and Arizona, along with the Texas border and its large metros, generate significant natural growth.
Now, looking at international migration, it’s clear that a large majority (75%) of US counties receive foreign population:
- Southern Florida, California, and Arizona benefit the most from international migration.
- Coastal communities in the Pacific Northwest and eastern seaboard also show “deep green” growth on this map.
- So do vast portions of the Rockies, upper Midwest, and southern coastline enjoy sizeable foreign migration.
Finally, when we look at inter-county migration, we see just how few regions in the US attract people on a net-positive basis. In fact, just 1 in 5 counties grew 1% or more each year due to domestic transplants:
- Central/East Texas up through southwest Missouri (including eastern OK and NW AR) show significant “capture” of domestic migrants.
- A straight line from west Texas to South Dakota show stark losses in net migration.
- The Mississippi River up to Illinois shows significant population out-migration.
- Tennessee is entirely green, as is most of northern Georgia, the Carolinas and Virginia.
- Far northern areas in Minnesota, Wisconsin, Michigan, New Hampshire and Maine experience high rates of migration due to retirees (who are fearless of the cold – wow!)
- Much of the Rockies are attracting people, led by Idaho and Utah.
- The southern border (including Miami), with its large international in-flows, tends to lose people who move on to other counties.
Conclusions? Understanding your own community’s population drivers is clearly fundamental to your economic development. Observing national trends can’t be ignored.
A few parting questions:
- How should communities respond when they produce natural growth (babies) but continue to lose people to migration? (CA, West Texas to the Dakotas)
- What happens if international migration drops even further - is the US prepared for a "zero population growth scenario"?
- When should retiree recruitment (and their wealth) get its due as economic development policy?
- Should economic developers continue to equate their primary impact with job creation, even with slowing US job and population growth and a historically low unemployment rate?
Post your thoughts or message me directly at my LinkedIn post for this article: https://www.linkedin.com/in/chris-engle/