Monthly Economic Scorecard Shows Performance for Metros
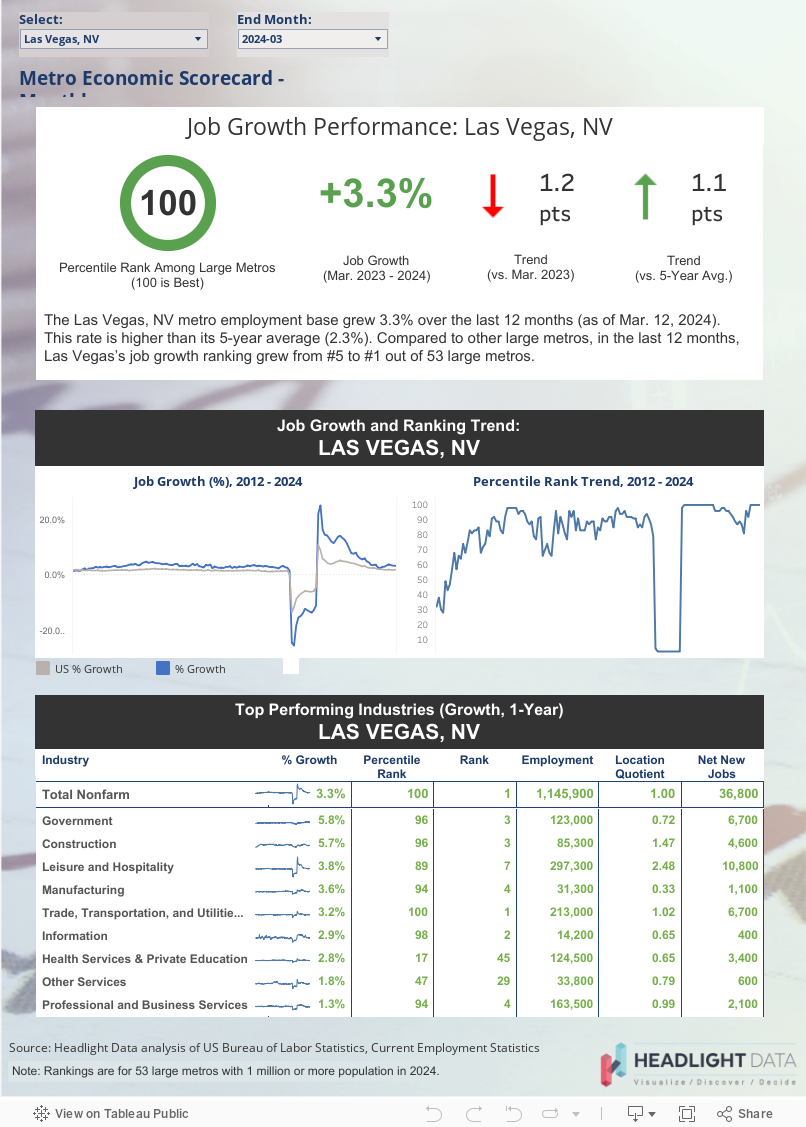
Headlight Data today released its updated Economic Scorecard for Metros, which shows performance versus metros of the same population size. Trend data shows performance over the last five years.
Data is available for select metros. Headlight analyzes data from the BLS' Current Employment Series.
To see your performance, select your metro and the latest month that has data (the latest two months are preliminary estimates from the BLS). Reports can be printed to PDF by clicking "Download" in the bottom-right corner.
Having trouble seeing the dashboard below? Visit our Tableau Public page.