COVID-19 Scorecard for States and the US
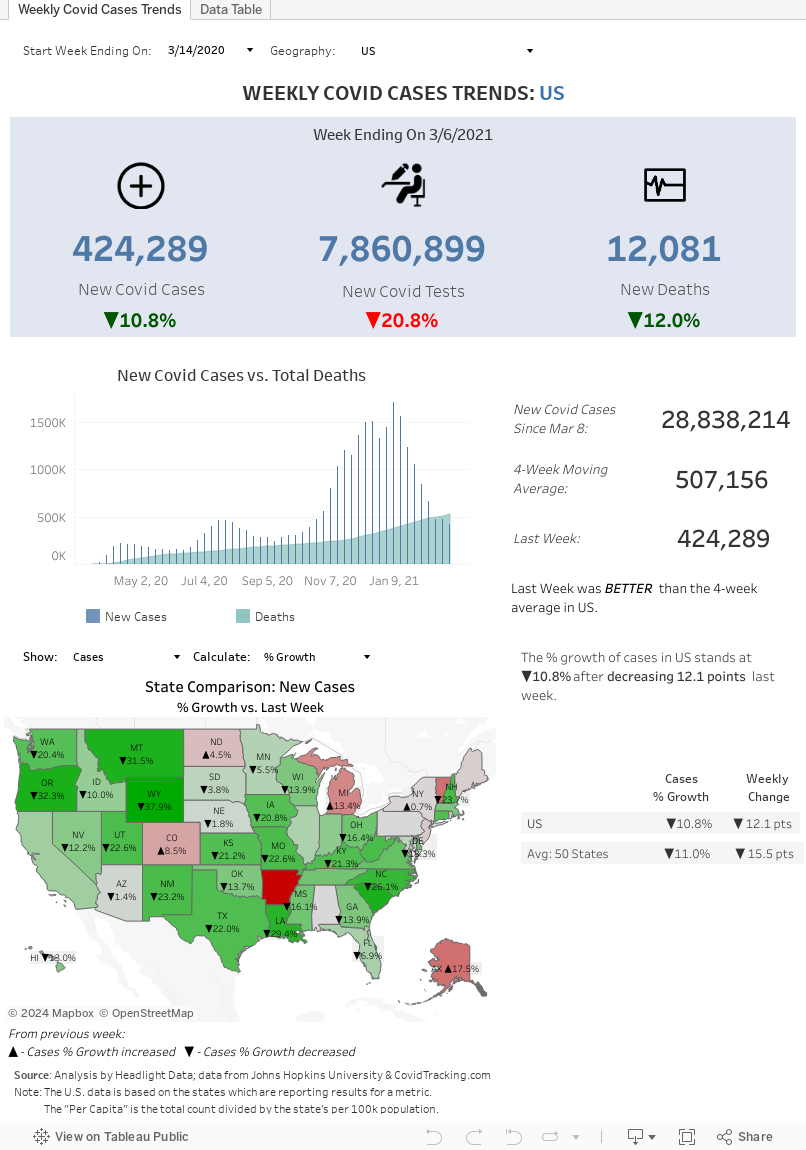
Headlight Data today released an updated version of our COVID-19 Scorecard for States and the US, which now includes number of tests, hospitalizations, in-ICU, and On-Ventilator if states report this data. Our tableau also allows users to see comparisons by state for per capita and % growth across all metrics to show where conditions have changed the most.
Data is available for all weeks since April 2020 and users can pick a state and customize the start week for the report's analysis and charts.
Reports can be printed to PDF by clicking “Download” in the bottom-right corner.
Having trouble seeing the dashboard below? Visit our Tableau Public page.