COVID-19 Scorecard for Counties, States and the US
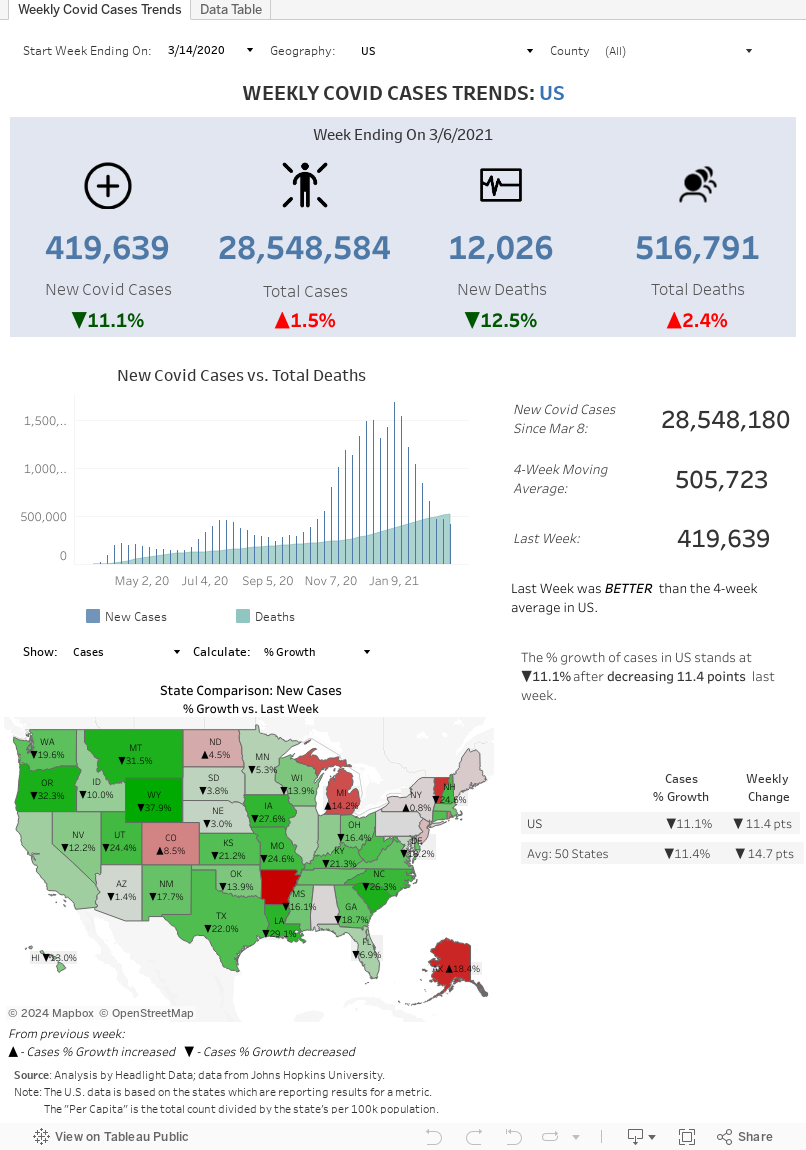
Headlight Data today released a version of our COVID-19 Scorecard specifically for Counties and also includes States and the US data, which includes number of Confirmed Covid Cases, and Deaths, if this data is reported. Our tableau also allows users to see comparisons by county, state for total counts, per capita and % growth across all metrics to show where conditions have changed the most.
Data is available for all weeks since April 2020 and users can pick a state and customize the start week for the report's analysis and charts.
Reports can be printed to PDF by clicking “Download” in the bottom-right corner.
Having trouble seeing the dashboard below? Visit our Tableau Public page.