15 Dec 2017 Mid-Sized Metros with Fastest Growing Gross Regional Product are Provo, Fayetteville and Tulsa; Slowest are Youngstown, Baton Rouge, Greensboro
Recently released data from the Bureau of Economic Analysis illuminates which mid-sized metros have the fastest growing Gross Regional Product (GRP). Growth is measured by the percentage change in GRP between 2011 and 2016. Headlight Data ranks growth for the 54 mid-sized metros (500,000-1,000,000 people) in the U.S.
In the last five years, Gross Regional Product grew 11% in the United States. Among mid-sized metros, the highest growth is found in Provo (32%), Fayetteville (22%), and Tulsa (19%). Other mid-sized metros with rapidly growing GRP are Des Moines, Cape Coral, and Akron.
The slowest growth in Gross Regional Product is found in Youngstown (-1.6%), Baton Rouge (-1.2%), and Greensboro (0.2%).

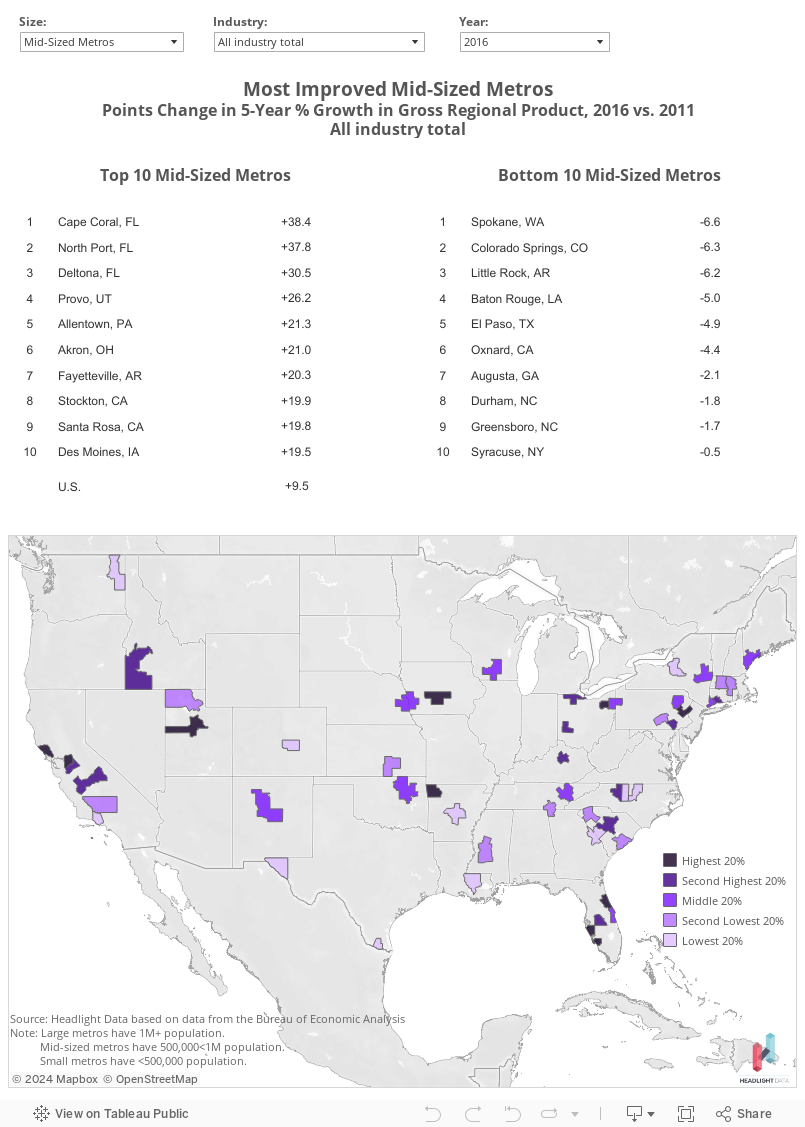
From 2006 to 2011, U.S. GRP rose 1.4%. The point change in the 5-year growth rate from 2011 to 2016 is 9.5 percentage points. The mid-sized metros showing the most improvement (with the greatest increase in the 5-year growth rate) are Cape Coral (+38 pts.), North Port (+37 pts.) and Deltona (+31 pts.). Provo, Allentown and Akron also experienced a substantial improvement.
The mid-sized metros with the largest decreases in growth rate in 2016 compared to 2011 are Spokane (6.6 pt. decrease), Colorado Springs (-6.3 pts.) and Little Rock (-6 pts.). Other metros with a declining 5-year growth rate since 2011 are Baton Rouge, El Paso and Oxnard.
Research, analysis and content developed by Headlight Data. Original data from the U.S. Bureau of Economic Analysis.
About Headlight Data:
Headlight Data is an award-winning online data aggregator, designed for economic and workforce development organizations, that provides online, decision-support tools on the economy, demographics, education, workforce and public policy.
Download Section:
Please click the ‘Download’ section at the bottom-right for all the download options.

Note: Permission is granted to re-publish, reference, quote or link back to this content, including charts and tables, as long as Headlight Data is appropriately cited as the source.
US Manufacturing Industry Enjoys Longest Growth Streak in 30 Years but Growth in 2016 Slows
Today, Headlight Data released its annual rankings of the fastest-growing US counties in manufacturing. Visit ... Read more
Large Metros with Fastest Growing Gross Regional Product Are San Jose, Austin and San Antonio; Slowest Are Tucson, Rochester, Hartford
Recently released data from the Bureau of Economic Analysis illuminates which large metros have the ... Read more