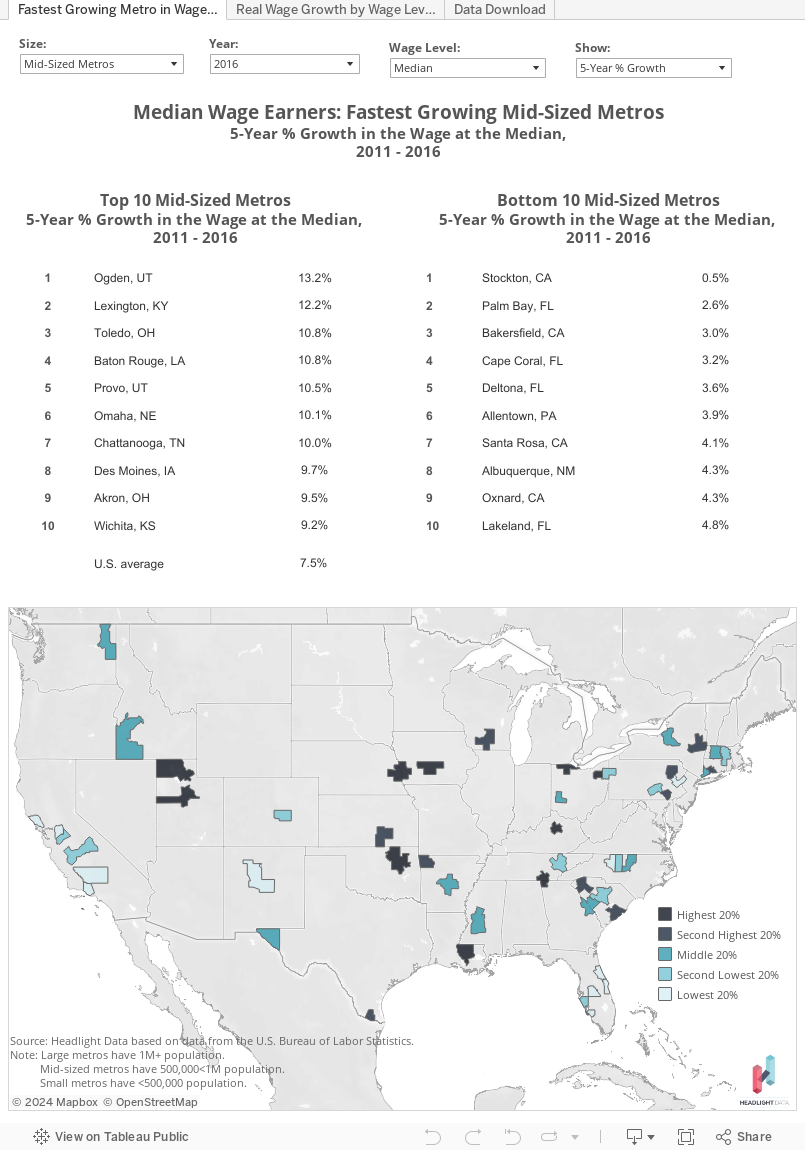
22 Dec 2017 Ogden, Lexington, Toledo See Largest Growth in Median Wage for Mid-Sized Metros since 2011; Stockton Wage Declined the Most
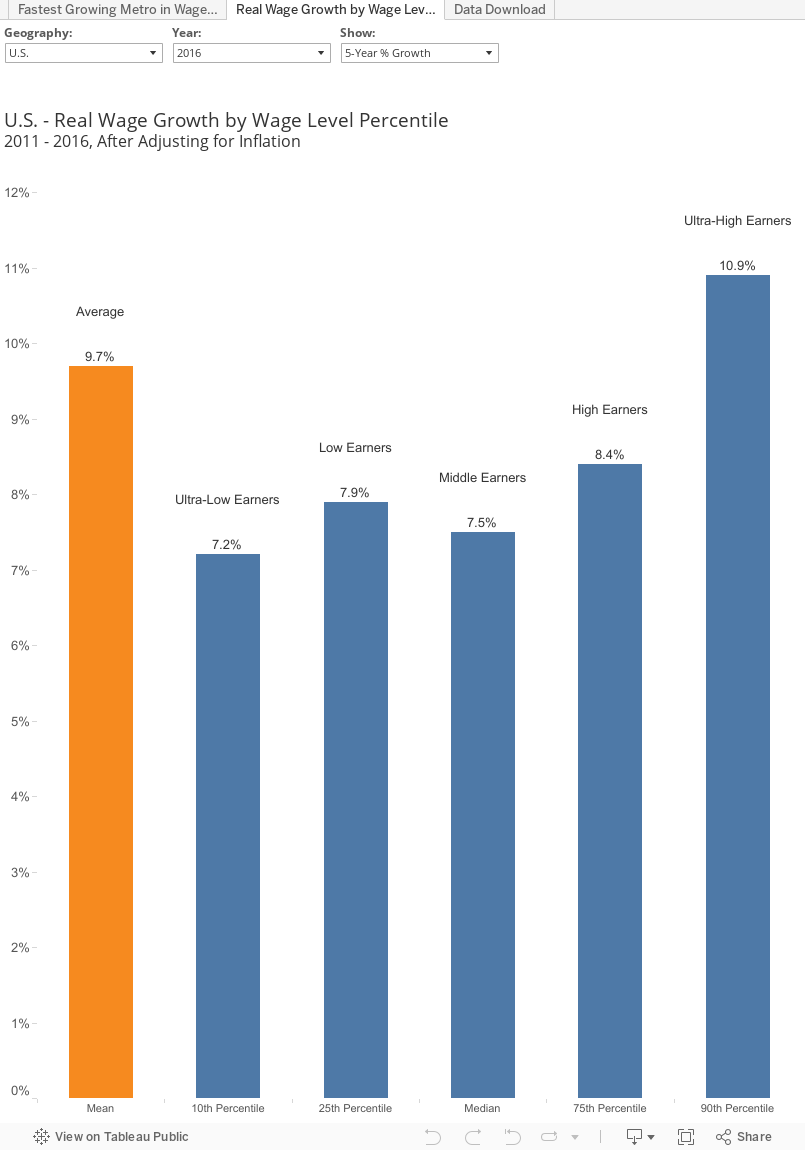
The Wage performance can be examined at the median wage level and also across the distribution of wages. Since 2011, Ultra-High Wage Earners in the U.S. enjoyed the fastest growing real wages (+10.9% at the 90th percentile) and Low-Wage Earners saw increasing wages (+7.9% at the 25th percentile). Ultra-Low Wage Earners saw positive wage growth (+7.2% at the 10th percentile). Wages are adjusted for inflation (made “real”).
(See footnote for a full explanation of percentile levels and wage groups)
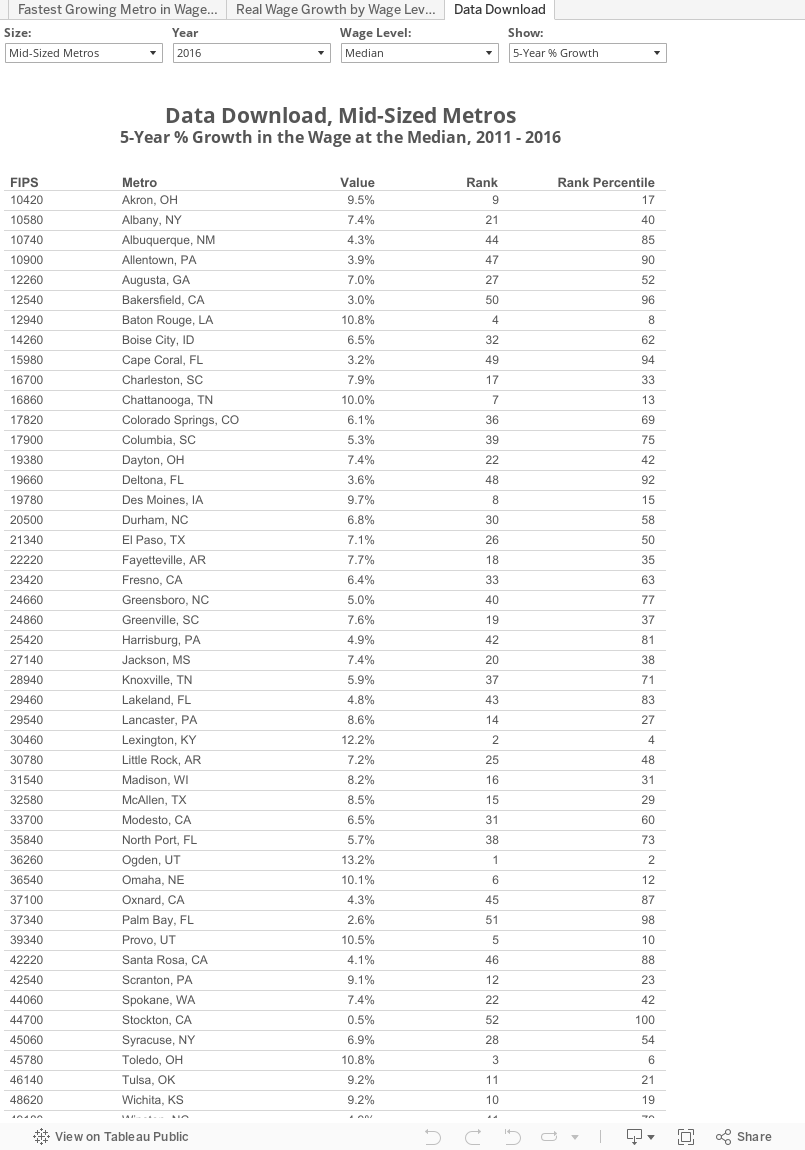
Examining this wage distribution across the 53 mid-sized metros (population 500,000 up to 1 million), the fastest-growing real median wage since 2011 was in Ogden (+13.2%), Lexington (+12.2%) and Toledo (+10.8%). Stockton had lowest wage growth (+0.5%), followed by Palm Bay (+2.6%) and Bakersfield (+3%).
At the High Wage level (top half of all wage earners), the mid-sized metros that generated the most wage growth were Baton Rouge (+13.7%), Lexington (+13.4%) and Provo (+12.6%). Modesto had the largest High Wage decrease (+1.6%), followed by Palm Bay (+1.6%) and Bakersfield (+2.1%).

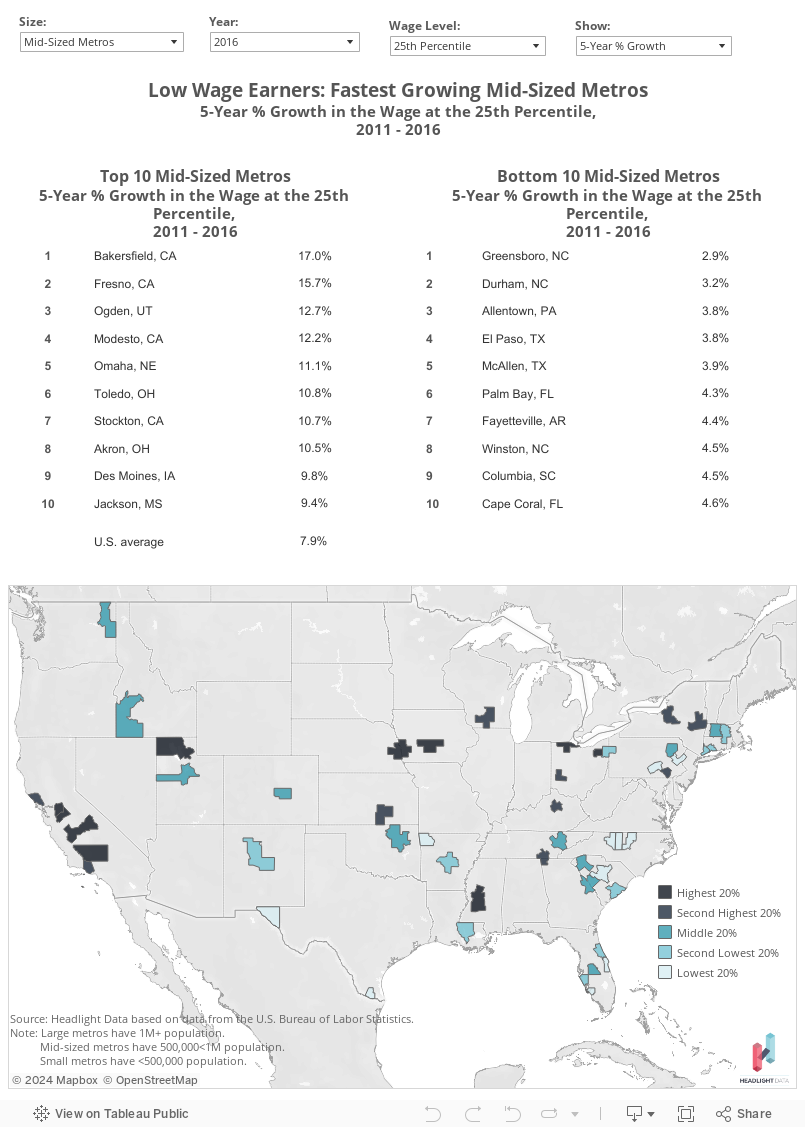
At the Low Wage Level (bottom half of all wage earners), the mid-sized metros that saw wages increased were Bakersfield (+17%), Fresno (+15.7%) and Ogden (+12.7%). Wages decreased the most in Greensboro (+2.9%), Durham (+3.2%) and El Paso (+3.8%).
At the Ultra-High Wage level (top 20% of all wage earners), Springfield had the highest wage growth (+15.3%), followed by Provo (+14.2%) and Des Moines (+14.2%). Wages decreased most in Cape Coral (+1.1%), McAllen (+1.5%) and North Port (+4.4%).

Note:
The U.S. Bureau of Labor Statistics releases percentile wage estimates as part of the Occupational Employment Statistics data. The median wage is the wage of workers in the middle of the distribution of all workers. Wages are also provided at the 10th, 25th, 75th, and 90th percentile. For example, the 25th percentile wage estimate is the wage value in which 25% of workers have lower wages. In 2014, North Dakota’s 25th percentile annual wage was $25,910, meaning that 25% of North Dakota employees earned less than $25,910 that year.
The percentile wage levels are used to form the following wage groups:
Ultra-Low Wage Earners = Bottom 20% of wage earners, whose median wage is at the 10th percentile.
Low Wage Earners = The bottom half of all wage earners, whose median wage is at 25th percentile.
High Wage Earners = The top half of all wage earners, whose median wage is at the 75th percentile.
Ultra-High Wage Earners = Top 20% of all wage earners, whose median wage is at the 90th percentile.
Research, analysis and content developed by Headlight Data. Original data from the U.S. Bureau of Labor Statistics.
About Headlight Data:
Headlight Data is an award-winning online data aggregator, designed for economic and workforce development organizations, that provides online, decision-support tools on the economy, demographics, education, workforce and public policy.
Download Section:
Please click the ‘Download’ section at the bottom-right for all the download options.
Note: Permission is granted to re-publish, reference, quote or link back to this content, including charts and tables, as long as Headlight Data is appropriately cited as the source.
Large Metros with Fastest Growing Gross Regional Product Are San Jose, Austin and San Antonio; Slowest Are Tucson, Rochester, Hartford
Recently released data from the Bureau of Economic Analysis illuminates which large metros have the ... Read more
Fastest Growing Mid-Sized Metro Economies of 2017 are Provo, Boise City, and Stockton; Slowest are Youngstown, Bridgeport, and Wichita
Recently released data from the U.S. Bureau of Labor Statistics show which mid-sized metros have ... Read more