30 Jun 2022 Annual Economic Scorecard Shows Performance for Counties, Metros, and States
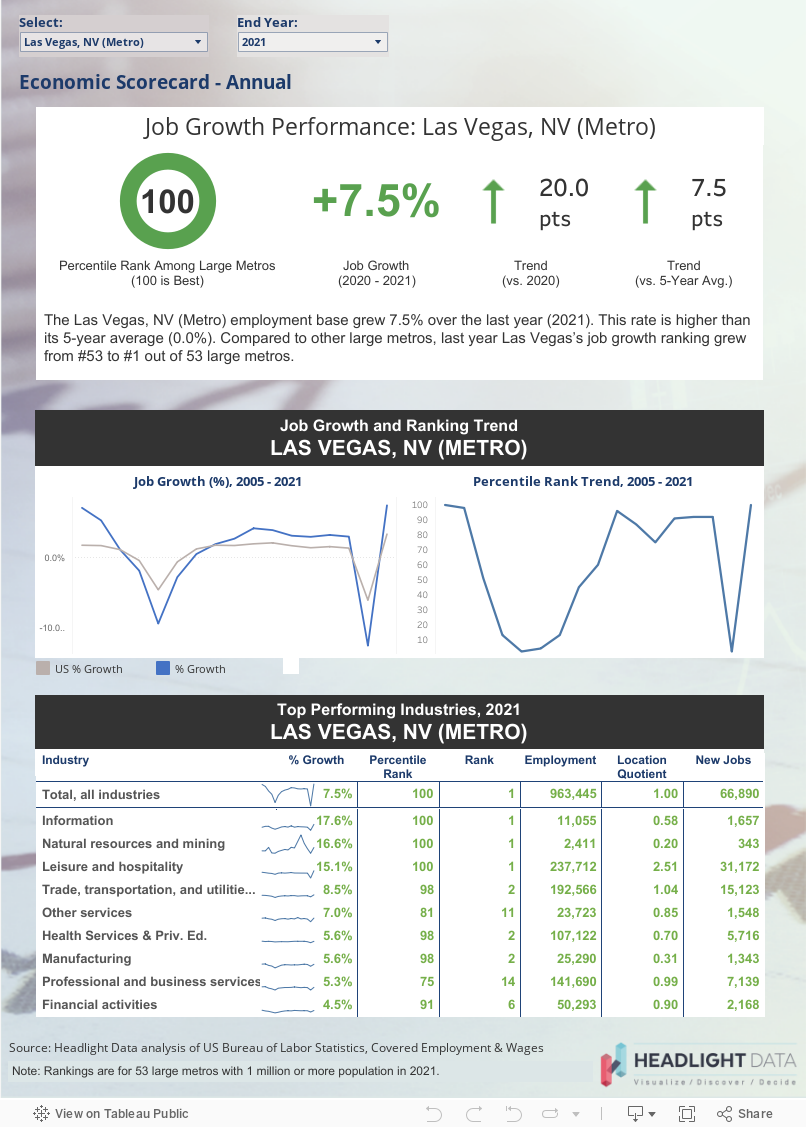
Headlight Data today released its updated Annual Economic Scorecard, which shows performance by year for counties, metros, and states. Trend data shows performance over the last ten years.
Headlight analyzes data from the BLS’ Quarterly Census of Employment and Wages (QCEW). This dataset lags the monthly “Current Employment Series (CES)” survey, but the CEW data is based on actual employment filings from businesses. And, CEW provides data at the county-level (CES does not).
To see your performance, select your community and the latest year that has data. Reports can be printed to PDF by clicking “Download” in the bottom-right corner.
Having trouble seeing the dashboard below? Visit our Tableau Public site.
Click here for a list of all metros by size.
COVID-19 Scorecard for States and the US
Headlight Data today released an updated version of our COVID-19 Scorecard for States and the ... Read more
Quarterly Economic Scorecard Shows Performance for Counties, Metros, and States
Headlight Data today released its updated Quarterly Economic Scorecard, which shows performance by quarter for ... Read more